


When mastering your music, one of the main goals is to ensure that it plays back appropriately in both stereo and mono, as well as across various different playback systems. Mastering meters can assist with optimizing playback by helping you to identify mix issues and reach certain target levels. A meter’s sole purpose is to provide you with some form of information about your music; this means you need to know how to make sense of the information it provides.
There are six essential mastering meters you’ll want to become acquainted with. These meters include spectrum analyzers, spectrograms, vectorscopes, phase correlation meters, level meters, and loudness meters; they can provide you with information about your music’s frequency spectrum, stereo image, and various types of levels.
Before reaching for any mastering tools or meters, I always start by listening to the mix I’m about to work on, in both stereo and mono, and on different sets of speakers. I’ll actually listen to a mix a couple times so that I can get familiar with it, and I’ll take notes on the song. These notes typically include things that I think I’ll be able to correct and/or enhance at a mastering level. The reason I go through this critical listening process before looking at my meters is that meters don’t have ears, and relying on them too heavily can sometimes influence my mastering decisions in a way that is counterproductive.
The mastering meter suite that I use is iZotope’s Insight 2. It includes all of the mastering meters on this list and more. This is by no means the only metering suite available, but it gets the job done and has a clean GUI. I like to place Insight 2 on my stereo bus and keep it open on a secondary computer monitor as I work. This frees up a substantial amount of space on my primary monitor for my other mastering devices.
Spectrum Analyzers
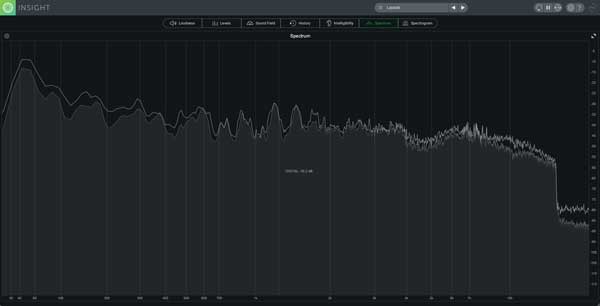
A spectrum analyzer is a graph that plots amplitude over frequency. As you play back your song, this graph will continue to update itself as its fed new material. While this is a relatively simple concept, a quality spectrum analyzer will allow you to view this information in many different ways.
iZotope Insight 2's spectrum analyzer lets you select how you would like it to process information; it gives you a choice between real-time and time averaged. From the Average Time drop-down menu, you can select Real Time, 1 sec, 3 secs, 5 secs, 10 secs, and Infinite. Smaller averaging times will result in a more dynamic spectrum that decays quickly over time and is useful for identifying specific elements in your mix. Larger averaging times will result in a less dynamic spectrum that decays slowly and can assist in providing you with a general sense of how your mix is balanced.
Spectrograms
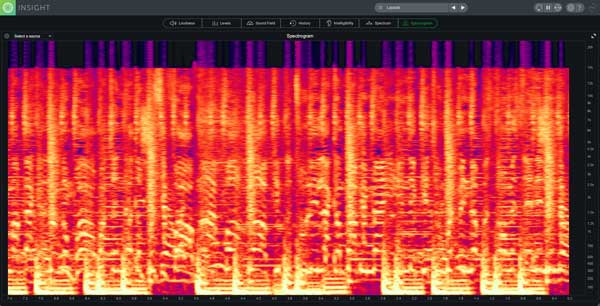
A spectrogram is quite similar to a spectrum analyzer, but instead of just providing you with a snapshot of amplitude over frequency, it adds a third variable: time. If you took a bunch of snapshots from a spectrum analyzer, sandwiched them together, and smoothed out the image, you’d basically end up with a spectrogram.
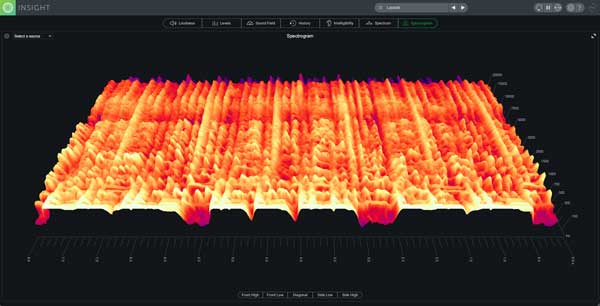
Spectrograms often come in the form of 2D displays that use color intensity to represent amplitude, an X value to represent time, and a Y value to represent frequency. They also come in the form of 3D displays, which tend to display information in a way that’s a bit easier to read than the information presented by a 2D display.
Vectorscopes
A vectorscope displays the similarities and differences between the two channels of a stereo signal. Mono signals will display a vertical line because the information being fed to both the left and right channels is identical. Stereo signals will produce more horizontal shapes as the stereo image widens. Three common vectorscopes include the polar sample vectorscope, polar level vectorscope, and Lissajous vectorscope.
A polar sample vectorscope uses a polar coordinate display to plot dots per sample. In phase signals are represented by patterns appearing within the 45-degree lines, while patterns emerging outside of these lines are out of phase. Keep in mind that not everything in your song needs to be in phase; if something sounds subjectively good in both stereo and mono across various playback systems, then it’s okay.
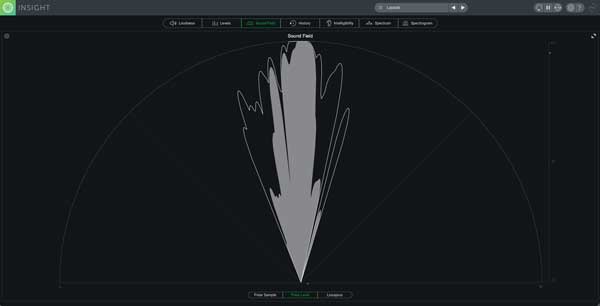
A polar level vectorscope uses a polar coordinate display to plot sample averages as rays. Amplitude is represented by the length of the ray, and the stereo image position is represented by the angle of the ray. This type of meter is particularly useful for making sure that elements panned across your stereo field are balanced relative to one another. Sometimes you’ll hear a mix that feels heavy to one side because the disproportionate level of an element is drawing too much of the listeners' attention in that direction; a polar level vectorscope can assist in identifying this type of issue.
A Lissajous vectorscope uses an oscilloscope display to plot per sample dots. A vertical pattern indicates that the left and right channels are similar to one another, while horizontal patterns indicate that the left and right channels are different from one another. This is yet another way to view the stereo image of your audio signal over time.

Phase Correlation Meters
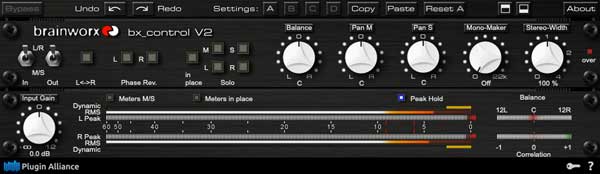
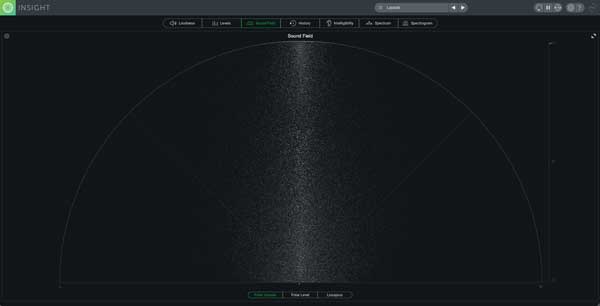
Perhaps the simplest way to tell if you have phase correlation problems is through the use of a phase correlation meter. This meter displays a line with a +1 on one end, and a -1 on the other end. There’s a dot that moves along this line, and the closer it sits to +1, the more in phase your signal is, while the closer it lies to -1, the more out of phase your signal is. iZotope's Insight 2 has a phase correlation meter built into its Sound Field module, but this type of meter can be seen a bit clearer in the bottom right corner of Brainworx bx_control V2 plugin.


Although this is a very simple meter to read, its downfall is that it doesn’t display phase correlation across the frequency spectrum. You could have a phase correlation issue in your low end, that’s making it seem like your entire track has phase correlation problems. For this reason, it’s important to take the readouts that a phase correlation meter provides with a grain of salt. If it’s showing you that there are in fact phase correlation issues, you’ll need to dig a little bit deeper to find out what is causing the problem.
Level Meters
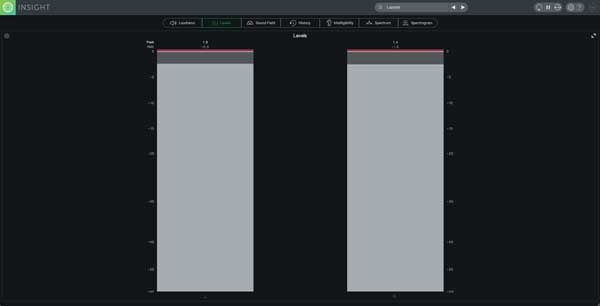
A decent level meter will provide you with true peak and RMS levels for your left and right channel. True peak level will indicate how much headroom you have at a given point in time. This is important if you want to ensure that you don’t clip your audio file when bouncing to fixed point bit depths.
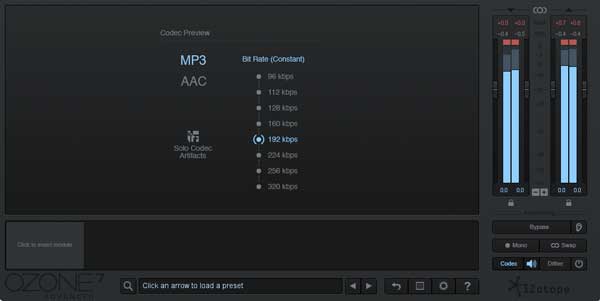
When you run an audio signal through a codec preview module such as the one in iZotope's Ozone, the true peak values of your audio file may very well increase, especially at lower bit rates. By auditioning your audio through a codec preview device, you’ll be able to ensure that regardless of how your audio is formatted, it has enough headroom to avoid clipping.
RMS (Root Mean Square) is calculated using a somewhat complicated equation that provides what is generally accepted as average peak level. The greater this number, the more dynamic your track, and the smaller this number, the less dynamic your track. RMS can still provide you with useful information about your music, but as a standard for loudness, it’s been pushed to the wayside. The following section will cover the current loudness standard in more detail.
Loudness Meters
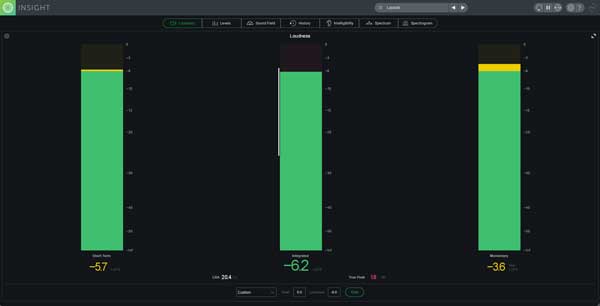
A loudness meter or LUFS (Loudness Unit Full Scale) meter displays perceived loudness. If two different songs are both hitting -18 LUFS on a loudness meter, you're probably going to perceive them as just as loud as one another. While this scale is extremely useful for setting target levels that are used to achieve perceived loudness consistency between songs on albums, it's also helped to combat the loudness wars.
Before streaming services began normalizing the level of songs, mastering engineers were attempting to increase the perceived loudness of many songs as much as possible; this is because people perceive sounds that are louder as better. It's actually for this very reason that streaming services began normalizing songs in the first place. With people sacrificing audio quality for loudness, a very unpleasant listening experience arose for music consumers. One of the main issues consumers were experiencing was quiet songs followed by loud songs; this caused them to turn the volume up on their listening device for the quiet song, which then forced them to turn the volume down for the louder song.
Spotify and other streaming services now normalize songs based on custom algorithms that they run. Ideally, each song that you now hear, as a consumer, sounds roughly just as loud as the next one on YouTube, Spotify, etc. Another bonus is that there is no point in sacrificing the audio quality of songs now to achieve greater loudness; the louder the song is perceived, the more it will be brought down in level.
LUFS meters are particularly useful when mastering for formats like CD that don't normalize your songs. Let's say you're mastering a 12 track album and you want each song to play back at the same perceived loudness. You can set a target LUFS value, and then apply processing in a way that will ensure that all your songs are hitting the target.
People still spend a lot of time trying to optimize the loudness of their songs for streaming services. Attempting to ensure consistent quality between songs is important if you're releasing an album, but if you're trying to cheat streaming service algorithms to maximize loudness upon playback, I think you're wasting your time for a few reasons.
First, the dynamic range of an audio file can play a role in the identity of a song’s genre. EDM has a “tight” sound and has become one of the defining characteristics of the genre. Recommended target LUFS values, such as -14 integrated LUFS for Spotify, are just too dynamic for this type of music. People seem to be afraid to surpass the normalization threshold of different streaming services, but at the end of the day, everything is going to sound like it's playing back at more or less the same level of perceived loudness.
Second, the entire reason streaming services started normalizing songs was to combat the need to sacrifice audio quality in favor of loudness. On top of this, each streaming service attenuates your audio files by a different amount. I recommend you mix and master your music so that it sounds subjectively "good," without sacrificing audio quality, while keeping in mind track "consistency," as opposed to "maximization."
For the most accurate estimate of how much your songs will be attenuated by streaming services, I recommend analyzing them using loudnesspenalty.com. This is a webpage curated by Ian Shepard of MeterPlugs that allows you to upload your songs, and see (with decent accuracy) how much they’ll be brought down by services like YouTube, Spotify, TIDAL, Pandora, and iTunes.
In the following video, I demonstrate how to use the LUFS meter built into FabFilter's Pro-L 2, modify LUFS levels, and hit appropriate loudness targets when mastering your music for streaming services and CD distribution.
Even though mastering meters don’t directly affect your audio signal, they’re incredibly useful when trying to identify mix issues and achieve certain target levels. Not only that, but you can actually learn a lot from other songs by analyzing them. Does your favorite artist clip their masters? Do they stereo spread their songs into oblivion? By analyzing the songs of different artists, you can gain insight into how they're mixing and mastering their music.
If you were interested, the song being analyzed in all the images for this article is a 192 kbps MP3 version of 100 Bars & Gunnin by Ramirez. You may have noticed that the top end, around 15 kHz, is completely cut; the intensity contrast this provides on some of the meters is why I chose the audio file that I did. The information that remains present above 15 kHz is just low level noise, which I'm assuming is the result of dither applied to the audio signal. Even though humans can technically hear up to around 20 kHz, lots of people can't hear much above 15-16 kHz. Some audio engineers choose to cut these frequencies away completely, although I personally prefer to leave that upper information intact.
In the world of digital audio, there is very rarely a “correct” way of doing things. Rules are made to be broken. If you’re happy with how your music sounds once uploaded to streaming services, you’ve accomplished what you’ve set out to do. Mastering for physical formats like vinyl is a bit of a different story, but I’ll save that for another article!
Want to produce radio-quality songs? Check out Black Ghost Audio's Music Production for Beginners video course. Produce three songs from start to finish and learn the skills you need to write, record, mix, and master music at home. No experience required. Click here to learn more and produce your first song in under an hour.


